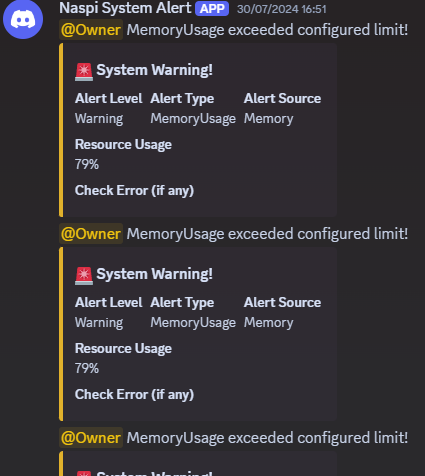
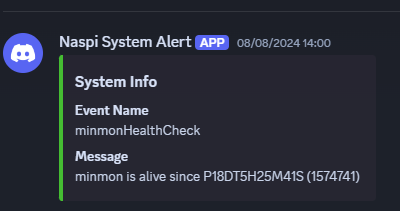
During my past data center monitoring projects. I often found myself in a situation where I needed a simplistic approach to resource monitoring and alerting. Of course, using Grafana and Prometheus' Node Exporter is one of the best ways to do it. However, several issues started to arise when I implemented it, such as:
- Limited resource on-prem machine, where the user spots only one machine for virtually everything for the monitoring system, including batch ELT pipelines for the sensor data, data management, and service deployment. Resulting in some interruptions if resource-expensive monitoring and alerting solutions are used.
- No internet access is given directly to the host machine; if required for the alerting to external services, they would create a new proxy to bridge the connection. Which often leads to inconvenience when setting up the production environment.
Due to these issues, I have to be resourceful for the resource usage of the monitoring and alerting for the services workloads. Usually, what I do is periodically check the Pressure Stall Information (PSI) stats given in /proc/pressure/cpu, /proc/pressure/memory , and /proc/pressure/io . An alert will be sent once it reaches the configured thresholds. And adding additional information if there are language features that could efficiently help me to reach the goal, such as Java Management Interface in ThreadMXBean.getThreadCpuTime() to the calculations.
Of course, adopting those unique situations slightly impacted on the project timeline and cost. Wondering if there's any similarly opinionated solutions that can reach the same goal. I stumbled upon flo-at's MinMon on GitHub recently
So let's try setting it up, I will use one of my homelab's node, a Raspberry Pi 4 with Ubuntu 20.04, 4GB of memory, and 4vCPUs, I choose to use MinMon's Docker deployment, so if you haven't installed Docker yet, go ahead and follow their documentation. As for the alerting, let's use Discord's webhook.

First and foremost, prepare a directory for the config, docker compose and the dotenv file, let's say minmon-config.
mkdir minmon-config && cd minmon-configThen create the dotenv file containing Discord's webhook url
MINMON_DISCORD_WEBHOOK=*********MinMon is opinionated so you can just follow config, furthermore, you still can define your own alert levels, in this case:
- INFO: I use info alert level to ensure that the monitoring still works, this would run on weekly basis
- WARNING: I set the level to warning if the resource starts to use 80% of the total node resources
- CRITICAL: I set the level to critical if the resource starts to use over 90% of the total node resources, and i will start to take action upon receiving this alert for set amount of times, so i set this alert to be sent 3 times
[[checks]]
disable = false
name = "MemoryUsage"
type = "MemoryUsage"
interval = 60
memory = true
swap = false
filter = {type = "Average", window_size = 10}

[[checks.alarms]]
disable = false
name = "Warning"
level = 75
cycles = 2
repeat_cycles = 3
action = "DiscordWarning"
error_repeat_cycles = 3
error_action = "DiscordWarning"

[[checks.alarms]]
disable = false
name = "Critical"
level = 90
cycles = 2
repeat_cycles = 3
action = "DiscordCritical"
error_repeat_cycles = 3
error_action = "DiscordCritical"


[[checks]]
disable = false
name = "FilesystemUsage"
type = "FilesystemUsage"
interval = 3600
mountpoints = ["/srv", "/home"]
filter = {type = "Average", window_size = 10}

[[checks.alarms]]
disable = false
name = "Warning"
level = 70
cycles = 2
repeat_cycles = 3
action = "DiscordWarning"
error_repeat_cycles = 3
error_action = "DiscordWarning"

[[checks.alarms]]
disable = false
name = "Critical"
level = 90
cycles = 2
repeat_cycles = 3
action = "DiscordCritical"
error_repeat_cycles = 3
error_action = "DiscordCritical"


[[checks]]
disable = false
name = "PressureAverage"
type = "PressureAverage"
interval = 1
io = "Both"
memory = "Both"
avg10 = false
avg60 = true
avg300 = false
filter = {type = "Average", window_size = 10}

[[checks.alarms]]
disable = false
name = "Warning"
level = 75
cycles = 2
repeat_cycles = 3
action = "DiscordWarning"
error_repeat_cycles = 3
error_action = "DiscordWarning"

[[checks.alarms]]
disable = false
name = "Critical"
level = 90
cycles = 2
repeat_cycles = 3
action = "DiscordCritical"
error_repeat_cycles = 3
error_action = "DiscordCritical"

[report]
cron = "0 0 7 * * 5"

[[report.events]]
name = "minmonHealthCheck"
action = "DiscordHealthInfo"

[[actions]]
name = "DiscordHealthInfo"
type = "Webhook"
url = "{{env:MINMON_DISCORD_WEBHOOK}}"
headers = {"Content-Type" = "application/json"}
body = """{"embeds":[{"color":"4504882","title":"System Info","fields":[{"name":"Event Name","value":"{{event_name}}","inline":false},{"name":"Message","value":"minmon is alive since {{minmon_uptime_iso}} ({{minmon_uptime}})","inline":false}]}]}"""

[[actions]]
name = "DiscordWarning"
type = "Webhook"
url = "{{env:MINMON_DISCORD_WEBHOOK}}"
headers = {"Content-Type" = "application/json"}
body = """{"allowed_mentions":{"roles":["***"]},"embeds":[{"color":"14790956","title":":rotating_light: System Warning!","fields":[{"name":"Alert Level","value":"{{alarm_name}}","inline":true},{"name":"Alert Type","value":"{{check_name}}","inline":true},{"name":"Alert Source","value":"{{check_id}}","inline":true},{"name":"Resource Usage","value":"{{level}}","inline":false},{"name":"Check Error (if any)","value":"{{check_error}}","inline":false}]}],"content":"<@&***> {{check_name}} exceeded configured limit!"}"""

[[actions]]
name = "DiscordCritical"
type = "Webhook"
url = "{{env:MINMON_DISCORD_WEBHOOK}}"
headers = {"Content-Type" = "application/json"}
body = """{"allowed_mentions":{"roles":["***"]},"embeds":[{"color":"12727830","title":":rotating_light: System Critical Alert!","fields":[{"name":"Alert Level","value":"{{alarm_name}}","inline":true},{"name":"Alert Type","value":"{{check_name}}","inline":true},{"name":"Alert Source","value":"{{check_id}}","inline":true},{"name":"Resource Usage","value":"{{level}}","inline":false},{"name":"Check Error (if any)","value":"{{check_error}}","inline":false}]}],"content":"<@&***> {{check_name}} exceeded configured limit!"}"""
More details about this is available on MinMon's documentation
Lastly, create the docker-compose file for the deployment
services:
  minmon:
    container_name: minmon
    restart: unless-stopped
    image: ghcr.io/flo-at/minmon:latest
    env_file: ".env"
    volumes:
      - ./minmon.toml:/etc/minmon.toml:ro
      # The following line is required for the DockerContainerStatus check.
      - /var/run/docker.sock:/var/run/docker.sock
docker compose up -dLet's try it out as I run backup photos job to immich and let the AI runs in batch.

As expected, the alerting works. And over time, it will let me know if the monitoring system is still alive
